Solar Flare Propels Coronal Mass Ejection Towards Earth and Likely Will Cause Geomagnetic Storms Starting Today, May 19, 2013
source
CME IMPACT: A CME hit Earth's magnetic field on May 19th at 2250 UT (3:50 PM PDT). Polar geomagnetic storms and high-latitude auroras are possible in the hours ahead. Stay tuned for updates.


 Right:
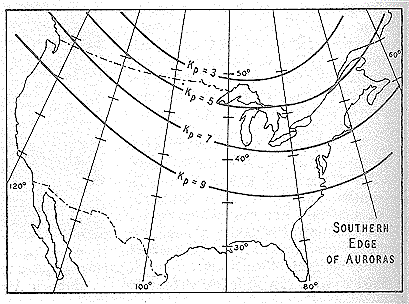
From thousands of observations, Cornell University scientists have
determined geographic subpoints for the southern edges of auroral
displays. The curves represent four values of the planetary index (Kp).
As this index increases, the aurora's southern edge moves southward.
In this article we briefly explain some of the ideas behind the association of the aurora with geomagnetic activity and a bit about how the ‘K-index’ or ‘K-factor’ works. The aurora is understood to be caused by the interaction of high energy particles (usually electrons) with neutral atoms in the earth's upper atmosphere. These high energy particles can ‘excite’ (by collisions) valence electrons that are bound to the neutral atom. The ‘excited’ electron can then ‘de-excite’ and return back to its initial, lower energy state, but in the process it releases a photon (a light particle). The combined effect of many photons being released from many atoms results in the aurora display that you see.
The details of how high energy particles are generated during geomagnetic storms constitute an entire discipline of space science in its own right. The basic idea, however, is that the Earth’s magnetic field (let us say the ‘geomagnetic field’) is responding to a outwardly propagating disturbance from the Sun. As the geomagnetic field adjusts to this disturbance, various components of the Earth’s field change form, releasing magnetic energy and thereby accelerating charged particles to high energies. These particles, being charged, are forced to stream along the geomagnetic field lines. Some end up in the upper part of the earth’s neutral atmosphere and the auroral mechanism begins.
The disturbance of the geomagnetic field may also be measured by an instrument called a magnetometer. At our operations center we receive magnetometer data from dozens of observatories in one minute intervals. The data is received at or near to ‘real-time’ and allows us to keep track of the current state of the geomagnetic conditions. In order to reduce the amount of data that our customers have to deal with we convert the magnetometer data into three-hourly indices which give a quantitative, but less detailed measure of the level of geomagnetic activity. The K-index scale has a range from 0 to 9 and is directly related to the maximum amount of fluctuation (relative to a quiet day) in the geomagnetic field over a three-hour interval.
The K-index is therefore updated every three hours and the information is made available to our customers as soon as possible. The K-index is also necessarily tied to a specific geomagnetic observatory. For locations where there are no observatories, one can only estimate what the local K-index would be by looking at data from the nearest observatory, but this would be subject to some errors from time to time because geomagnetic activity is not always spatially homogenous. Another item of interest is that the location of the aurora usually changes geomagnetic latitude as the intensity of the geomagnetic storm changes. The location of the aurora often takes on an ‘oval-like’ shape and is appropriately called the auroral oval. A useful map of the approximate location of the auroral oval as a function of the Kp-index was published in the June 1968 copy Sky & Telescope (see page 348). The Kp index is derived through by an algorithm that essentially averages the K-indices from several stations. Note that as a storm becomes more intense, the edge of the auroral boundary typically moves to lower latitudes.
For further reading we can recommend a couple of books for you. An old, but classic text is The Polar Aurora, Oxford University Press, 1955, by Störmer. A more modern text is The Physics of Space Plasmas, 1991, by George Parks. If you are interested in real-time reporting of geomagnetic activity please make use of our 24-hour/day, 7 day/week services. We have an internet home page address (/), and a recorded message which is updated every three hours or as major activity occurs (303-497-3235). You can also reach us at 303-497-3204. We hope that you find this information helpful. If you have some further questions please don’t hesitate to let us know. Best wishes ! Chris Balch (cbalch@sec.noaa.gov)
Updated at: 2013 May 19 2200 UTC
ACTIVE:
Geomagnetic Storm Forecasts
The geomagnetic storm probabilities are the estimated chances of at least one 3-hour K index, at the indicated level, for each of the next 3 days.
Active: K = 4.
Minor storm: K = 5.
Major or Severe storm: K > 6.
The "K index" is a 3-hourly quasi-logarithmic local index of geomagnetic activity relative to an assumed quiet-day curve for the recording site. Range is from 0 to 9. The K index measures the deviation of the most disturbed horizontal component of the magnetic field.
http://spaceweather.com/glossary/geostorm.html
MINOR:
Geomagnetic Storm Forecasts
The geomagnetic storm probabilities are the estimated chances of at least one 3-hour K index, at the indicated level, for each of the next 3 days.
Active: K = 4.
Minor storm: K = 5.
Major or Severe storm: K > 6.
The "K index" is a 3-hourly quasi-logarithmic local index of geomagnetic activity relative to an assumed quiet-day curve for the recording site. Range is from 0 to 9. The K index measures the deviation of the most disturbed horizontal component of the magnetic field.
http://spaceweather.com/glossary/geostorm.html
http://spaceweather.com/glossary/geostorm.html
Extreme weather events possibly linked.
(CNN) -- [Breaking news update at 2:05 a.m. ET]
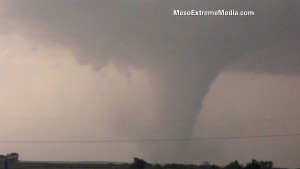
 Tornadoes leave path of destruction
 See funnel cloud in Oklahoma
 See massive tornado in Kansas
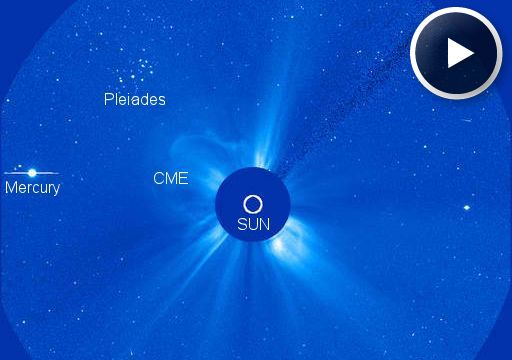
The CME was propelled toward Earth on May 17th by an M3-class solar flare in the magnetic canopy of sunspot AR1748. SOHO took this picture of the CME racing away from the sun at 1500 km/s (3.4 million mph):
It was hurled into space by an M3-class solar flare in the magnetic canopy of sunspot AR1748. In the video, the CME appears to hit Mercury, but it does not. It is merely passing in front of the innermost planet. The planet in the line of fire is Earth.
AURORAS INVADE THE USA: A
CME hit Earth's magnetic field on May 18th at around 0100 UT. Although
it was just a glancing blow, the impact was enough to spark a G1-class
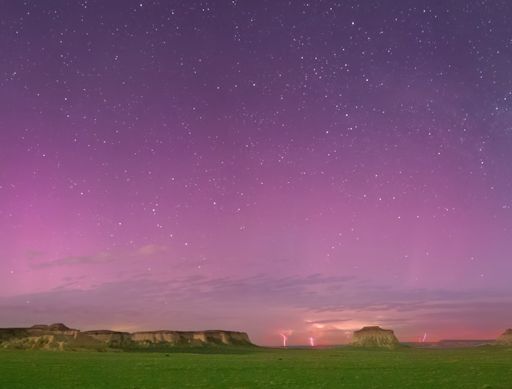
geomagnetic storm. In the United States, Northern Lights descended as far south as Pawnee Buttes, Colorado:
"The aurora was not visible to the naked eye," says photographer Robert
Arn. "Only with a 30 second exposure did I know it was there. As I
started to collect data, I noticed an electrical storm in the distance.
The juxtaposition of the electrical storm and aurora made for a
spectacular image. (The moon near the horizon illuminated the
landscape.)"
Elsewhere in the United States, faint auroras were photographed in Michigan, Massachusetts, Washington, Vermont, and Iowa. Browse the aurora gallery for more sightings.
source: http://spaceweather.com/
Planetary K-index
Now: Kp= 2 quiet
24-hr max: Kp= 4 unsettled
explanation | more data
Interplanetary Mag. Field
Btotal: 13.8 nT
Bz: 3.3 nT south explanation | more data
Updated: Today at 2357 UT
Now: Kp= 2 quiet
24-hr max: Kp= 4 unsettled
explanation | more data
Btotal: 13.8 nT
Bz: 3.3 nT south explanation | more data
Updated: Today at 2357 UT


The K-index
The K-index is a code that is related to the maximum fluctuations of
horizontal components observed on a magnetometer relative to a quiet
day, during a three-hour interval. The conversion table from maximum
fluctuation (nT) to K-index, varies from observatory to observatory in
such a way that the historical rate of occurrence of certain levels of K are about the same at all observatories. In practice this means that observatories at higher geomagnetic latitude require higher levels of fluctuation for a given K-index. The conversion table for the Boulder magnetometer is shown below:
K
|
nT
|
|---|---|
0
|
0-5
|
1
|
5-10
|
2
|
10-20
|
3
|
20-40
|
4
|
40-70
|
5
|
70-120
|
6
|
120-200
|
7
|
200-330
|
8
|
330-500
|
9
|
>500
|
At SWPC, we monitor the preliminary values of the K-index, minute by
minute, from a network of observatories that relay data in near-real
time. The final K-indices are determined after the end of prescribed
three hourly intervals (0000-0300, 0300-0600, ..., 2100-2400). The
maximum positive and negative deviations during the 3-hour period are
added together to determine the total maximum fluctuation. These maximum
deviations may occur anytime during the 3-hour period.
source: http://www.swpc.noaa.gov
Relationship between Kp and the Aurora [ref]
 Right:
From thousands of observations, Cornell University scientists have
determined geographic subpoints for the southern edges of auroral
displays. The curves represent four values of the planetary index (Kp).
As this index increases, the aurora's southern edge moves southward.
 In this article we briefly explain some of the ideas behind the association of the aurora with geomagnetic activity and a bit about how the ‘K-index’ or ‘K-factor’ works. The aurora is understood to be caused by the interaction of high energy particles (usually electrons) with neutral atoms in the earth's upper atmosphere. These high energy particles can ‘excite’ (by collisions) valence electrons that are bound to the neutral atom. The ‘excited’ electron can then ‘de-excite’ and return back to its initial, lower energy state, but in the process it releases a photon (a light particle). The combined effect of many photons being released from many atoms results in the aurora display that you see.
The details of how high energy particles are generated during geomagnetic storms constitute an entire discipline of space science in its own right. The basic idea, however, is that the Earth’s magnetic field (let us say the ‘geomagnetic field’) is responding to a outwardly propagating disturbance from the Sun. As the geomagnetic field adjusts to this disturbance, various components of the Earth’s field change form, releasing magnetic energy and thereby accelerating charged particles to high energies. These particles, being charged, are forced to stream along the geomagnetic field lines. Some end up in the upper part of the earth’s neutral atmosphere and the auroral mechanism begins.
The disturbance of the geomagnetic field may also be measured by an instrument called a magnetometer. At our operations center we receive magnetometer data from dozens of observatories in one minute intervals. The data is received at or near to ‘real-time’ and allows us to keep track of the current state of the geomagnetic conditions. In order to reduce the amount of data that our customers have to deal with we convert the magnetometer data into three-hourly indices which give a quantitative, but less detailed measure of the level of geomagnetic activity. The K-index scale has a range from 0 to 9 and is directly related to the maximum amount of fluctuation (relative to a quiet day) in the geomagnetic field over a three-hour interval.
The K-index is therefore updated every three hours and the information is made available to our customers as soon as possible. The K-index is also necessarily tied to a specific geomagnetic observatory. For locations where there are no observatories, one can only estimate what the local K-index would be by looking at data from the nearest observatory, but this would be subject to some errors from time to time because geomagnetic activity is not always spatially homogenous. Another item of interest is that the location of the aurora usually changes geomagnetic latitude as the intensity of the geomagnetic storm changes. The location of the aurora often takes on an ‘oval-like’ shape and is appropriately called the auroral oval. A useful map of the approximate location of the auroral oval as a function of the Kp-index was published in the June 1968 copy Sky & Telescope (see page 348). The Kp index is derived through by an algorithm that essentially averages the K-indices from several stations. Note that as a storm becomes more intense, the edge of the auroral boundary typically moves to lower latitudes.
For further reading we can recommend a couple of books for you. An old, but classic text is The Polar Aurora, Oxford University Press, 1955, by Störmer. A more modern text is The Physics of Space Plasmas, 1991, by George Parks. If you are interested in real-time reporting of geomagnetic activity please make use of our 24-hour/day, 7 day/week services. We have an internet home page address (/), and a recorded message which is updated every three hours or as major activity occurs (303-497-3235). You can also reach us at 303-497-3204. We hope that you find this information helpful. If you have some further questions please don’t hesitate to let us know. Best wishes ! Chris Balch (cbalch@sec.noaa.gov)
| SPACE WEATHER NOAA Forecasts |  |
FLARE
|
0-24 hr
|
24-48 hr
|
CLASS M
|
65 %
|
65 %
|
CLASS X
|
25 %
|
25 %
|
source: source: http://spaceweather.com/ source: http://www.swpc.noaa.gov/rt_plots/xray_5m.html  source: http://www.swpc.noaa.gov/ace/MAG_SWEPAM_24h.html Geomagnetic Storms: Probabilities for significant disturbances in Earth's magnetic field are given for three activity levels:active, minor storm, severe storm
|
ACTIVE:
Geomagnetic Storm Forecasts
The geomagnetic storm probabilities are the estimated chances of at least one 3-hour K index, at the indicated level, for each of the next 3 days.
Active: K = 4.
Minor storm: K = 5.
Major or Severe storm: K > 6.
The "K index" is a 3-hourly quasi-logarithmic local index of geomagnetic activity relative to an assumed quiet-day curve for the recording site. Range is from 0 to 9. The K index measures the deviation of the most disturbed horizontal component of the magnetic field.
http://spaceweather.com/glossary/geostorm.html
MINOR:
Geomagnetic Storm Forecasts
The geomagnetic storm probabilities are the estimated chances of at least one 3-hour K index, at the indicated level, for each of the next 3 days.
Active: K = 4.
Minor storm: K = 5.
Major or Severe storm: K > 6.
The "K index" is a 3-hourly quasi-logarithmic local index of geomagnetic activity relative to an assumed quiet-day curve for the recording site. Range is from 0 to 9. The K index measures the deviation of the most disturbed horizontal component of the magnetic field.
http://spaceweather.com/glossary/geostorm.html
SEVERE:
Geomagnetic Storm Forecasts
The geomagnetic storm probabilities are the estimated chances of at least one 3-hour K index, at the indicated level, for each of the next 3 days.
Active: K = 4.
Minor storm: K = 5.
Major or Severe storm: K > 6.
The "K index" is a 3-hourly quasi-logarithmic local index of geomagnetic activity relative to an assumed quiet-day curve for the recording site. Range is from 0 to 9. The K index measures the deviation of the most disturbed horizontal component of the magnetic field.
http://spaceweather.com/glossary/geostorm.html
Extreme weather events possibly linked.
(CNN) -- [Breaking news update at 2:05 a.m. ET]
(CNN) -- A tornado
touched down in Golden City, Missouri, early Monday morning and tore
through two counties, Barton County Emergency Management Director Tom
Ryan said. The number of injuries and extent of damage were not
immediately clear.
[Breaking news update at 1:56 a.m. ET]
(CNN) -- Two people
missing from a trailer park in central Oklahoma have been found,
Pottawatomie County Sheriff Mike Booth said. The two residents were not
there when a tornado devastated Steelman Estates, destroying homes.
[Earlier story, updated at 11:25 p.m. ET]
Four-state tornado outbreak kills 1
(CNN) -- At least one
person was killed and around a dozen injured Sunday when a string of
tornadoes tore through four states, ripping roofs off homes, downing
power lines and tossing trees like matchsticks.
The death happened at a
trailer park in Pottawatomie County, Oklahoma, said Sheriff Mike Booth.
He had no details, other than that the deceased was an adult male.
Rescue crews were picking through the mangled metal remains of mobile homes as darkness fell Sunday.
 Tornadoes leave path of destruction
 See funnel cloud in Oklahoma
 See massive tornado in Kansas
Photos: Weather around the world
As many as 26 tornadoes
were reported in Oklahoma, Kansas, Illinois and Iowa, according to the
National Weather Service, with Oklahoma and Kansas being the hardest
hit. Some of those reports might have been of the same tornado.
Oklahoma Gov. Mary Fallin declared a state of emergency for 16 counties.
One tornado touched down near Wellston, Oklahoma, taking out power lines and damaging several homes, according to video from CNN affiliate KFOR. The affiliate's helicopter pilot estimated the funnel cloud to be about a half-mile wide.
"It's tearing up everything," the pilot said. "Just ripping everything up in its sight."
Aerial video from KFOR and CNN affiliate KOCO
showed severe damage near Wellston and near Carney, Oklahoma. Roofs
were ripped from homes, branches stripped from trees and roads were
filled with debris.
Tornadoes were also reported east of Dale, west of Paden, and near Prague in Oklahoma.
Part of Interstate 40 in
Shawnee, Oklahoma, was shut down in both directions Sunday night after a
tornado touched down there, overturning multiple tractor-trailers.
Eleven patients were
being treated at St. Anthony Shawnee Hospital in Shawnee, Oklahoma, said
spokeswoman Carla Tollett. Ten were not critical and will be released,
while one remains in critical condition, she said.
Still more tornadoes were spotted in Iowa, near Earlham, Huxley and east of Dallas Center, according to the weather service.
It did not mince words, telling people to take cover there, as elsewhere.
"You could be killed if
not underground or in a tornado shelter. Complete destruction of
neighborhoods, businesses and vehicles will occur. Flying debris will be
deadly to people and animals," it said in a Kansas advisory.
The twisters are part of a severe weather outbreak that is sweeping through the region as storms move east.
Baseball-sized hail, wind gusts and tornadoes are threatening to pummel parts of the central Plains and Midwest through Monday.
"We still have a couple
of active cells, and so we don't know for sure that it's over yet," said
Jerry Lojka with the Oklahoma Department of Emergency Management.
Beyond the Midwest,
other areas saw severe weather on Sunday. In Atlanta, serious flooding
was reported amid storms producing heavy rainfall.
Here's a quick look at CNN meteorologist Melissa Le Fevre's forecast for Monday for hard-hit Midwestern states:
Kansas
The surface front may
stall on Monday, leading to showers and thunderstorms through the day.
Localized heavy rainfall may lead to the need for flood watches and
warnings.
Oklahoma
There is a threat for
strong storms in the late afternoon. With the heavy rain that will occur
through the weekend, flooding could become a problem Monday night.
Iowa
Showers and storms are
expected to develop on Monday afternoon. Large hail is possible and
though the tornado threat looks low, it cannot be ruled out.
Missouri
Flooding is expected to
become an issue after localized heavy rainfall. Afternoon storms could
produce large hail, damaging wind gusts and possible tornadoes. In St.
Louis, storms will reorganize during the afternoon and evening hours.
Threats include large hail, damaging winds and the possibility of
tornadoes.

